 RAMKeeper
You paid the RAM tax.
Make every gigabyte count.
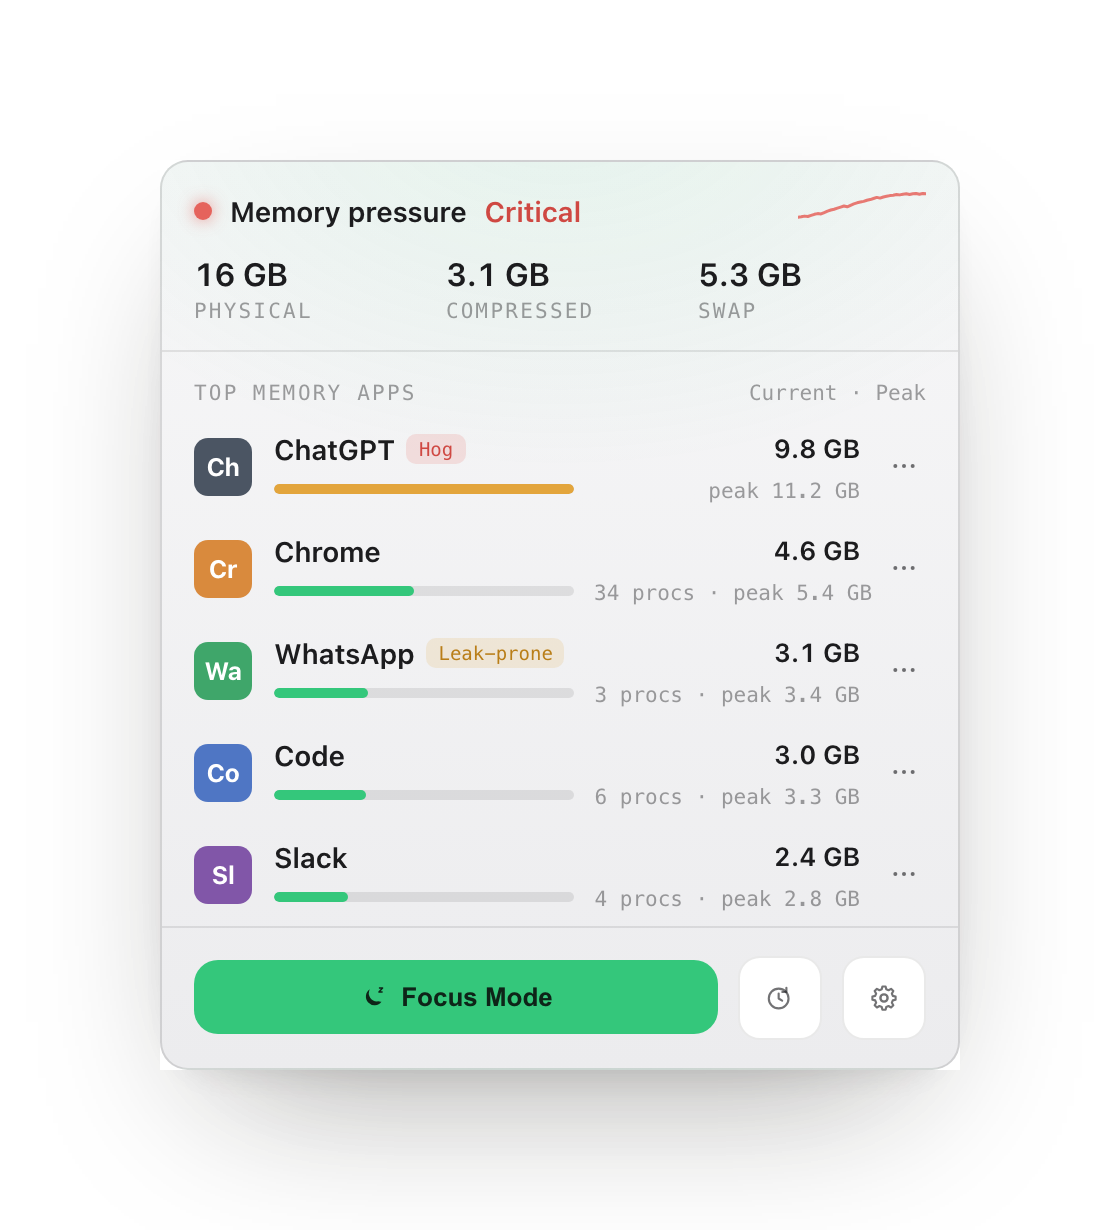
Memory got expensive in 2026, so you bought the base-RAM Mac. RAMKeeper shows exactly what's eating it - ChatGPT, Slack, Chrome - and gives you rules to deal with it. No placebos, just the real numbers macOS reports.
No placebos
A jumpy "memory freed" number proves nothing.
macOS already manages and compresses memory aggressively. So we skip the theater and do only three things that genuinely move the needle - every one backed by real before-and-after numbers.
Precise attribution
Memory broken down per app and per renderer process. Auto-flags hogs like ChatGPT, Slack and Chrome Helper, with current vs. peak.
Threshold control
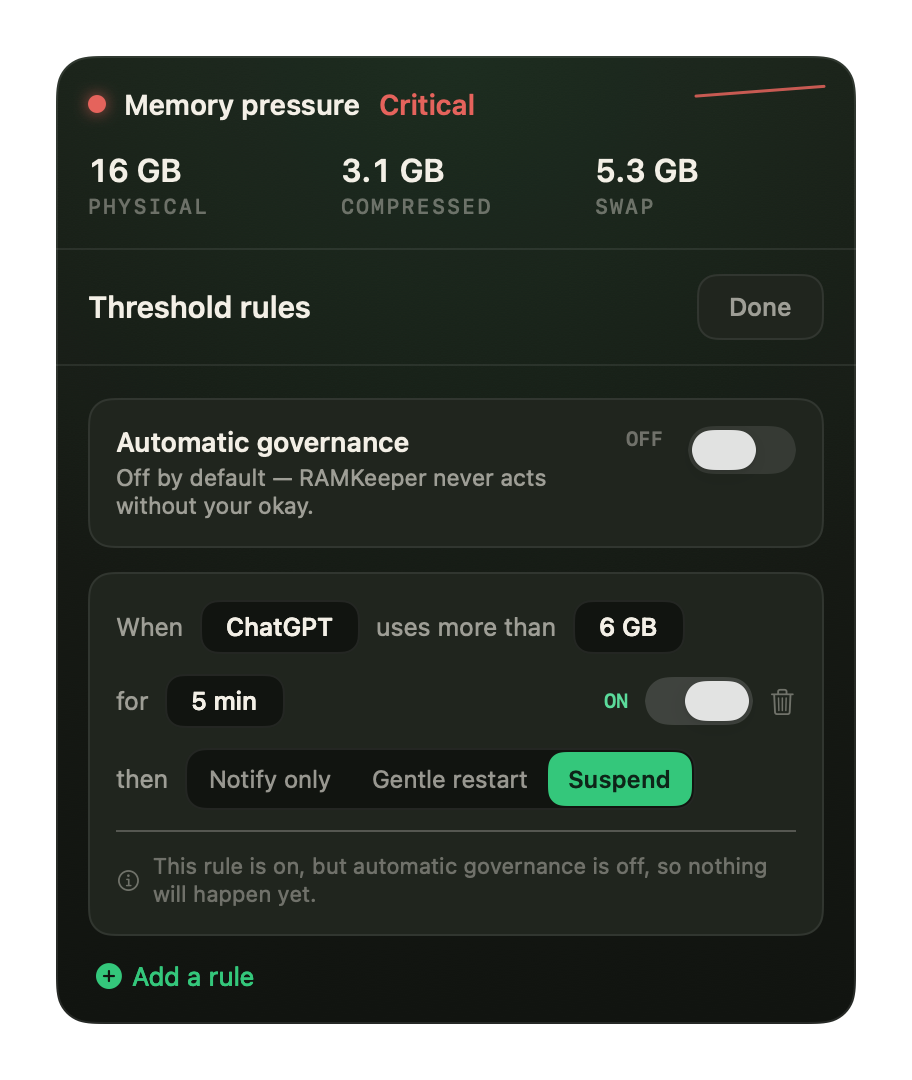
Set a memory ceiling for an app. If it stays over that ceiling for the whole window you chose, RAMKeeper acts on your rule - not on a guess - and logs exactly what it did.
Focus Mode
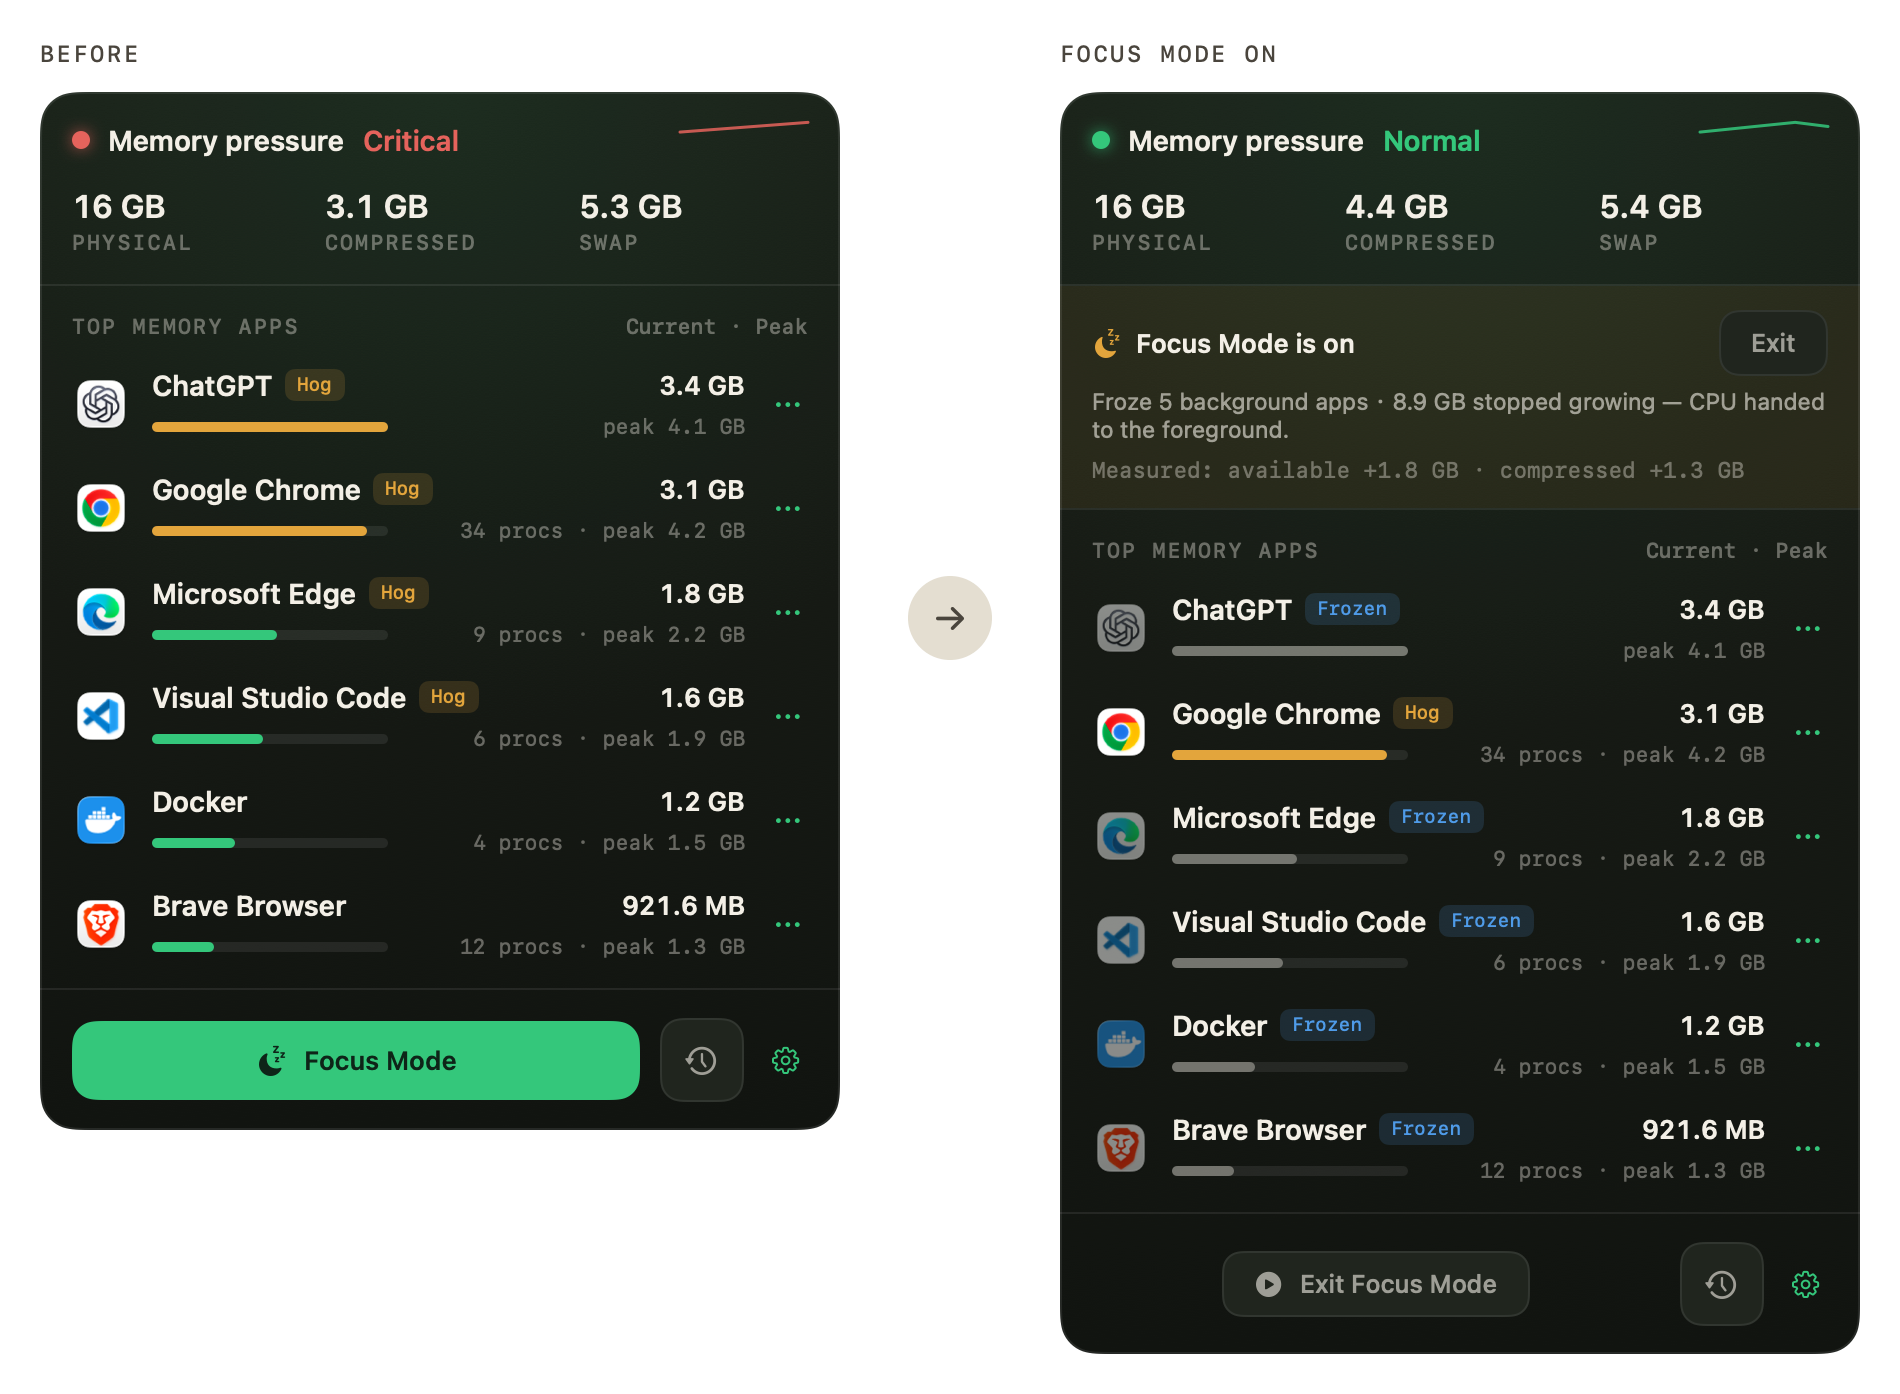
Suspend a whole batch of background apps in one click, then resume them when you're back. They stop growing and stop competing for CPU, so the app you're actually using gets the machine.
See it in action
Real UI. Real numbers, straight from macOS.
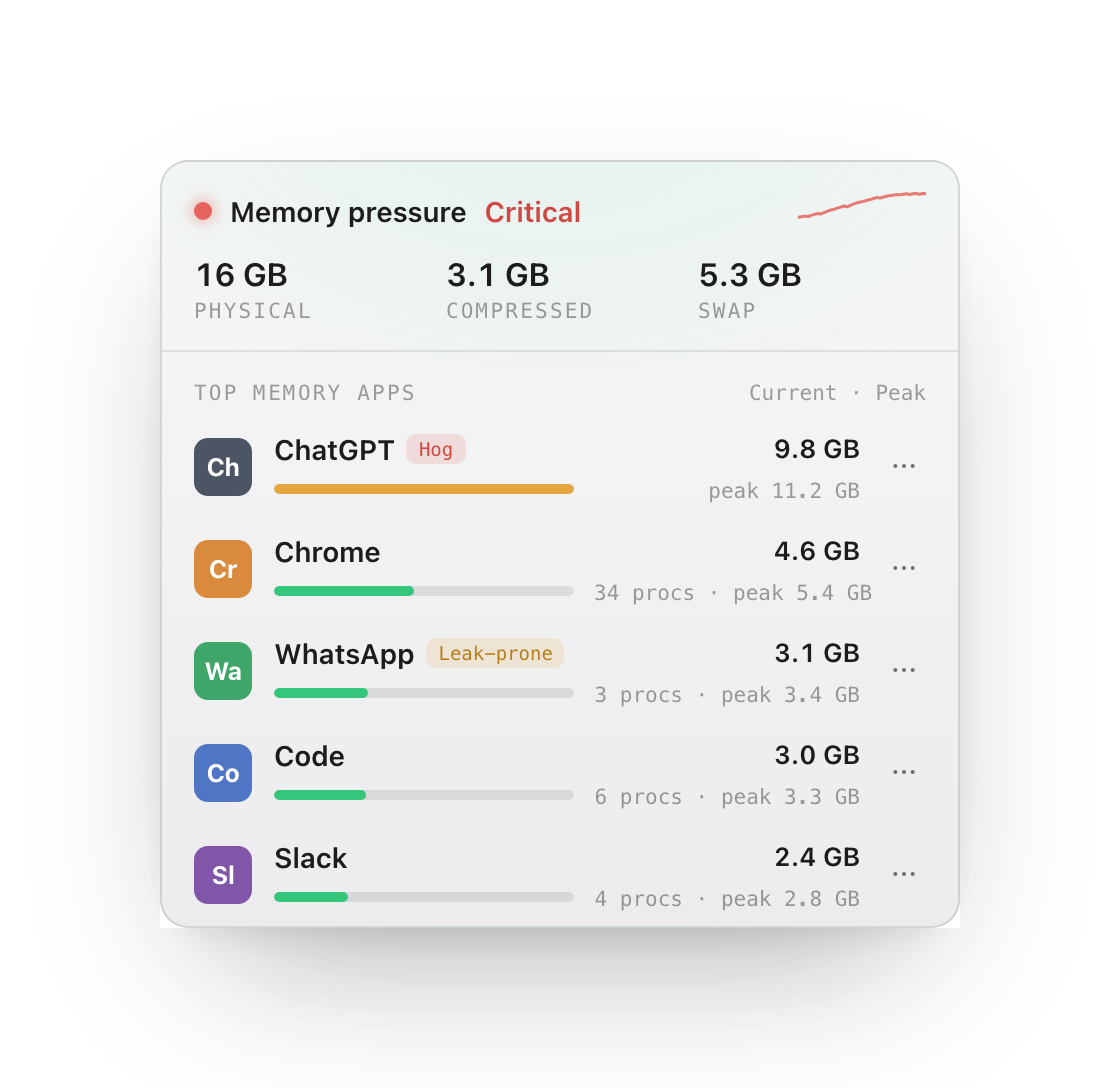
Pinpoint the real culprit.
Browser and Electron helpers are grouped under their parent app, with current vs. peak - so you see the true cost of each window, not a wall of mystery processes.
Set a limit, let it govern.
When an app crosses your threshold for long enough, RAMKeeper can notify, gently restart, or suspend it. Off by default - it never acts without your okay.
One click. Five apps stop competing.
Focus Mode freezes a batch of heavy background apps: they stop allocating, stop competing for CPU, and their pages go cold - prime candidates for macOS to compress. Exit, and everything resumes exactly where it was - nothing is quit, nothing is lost.
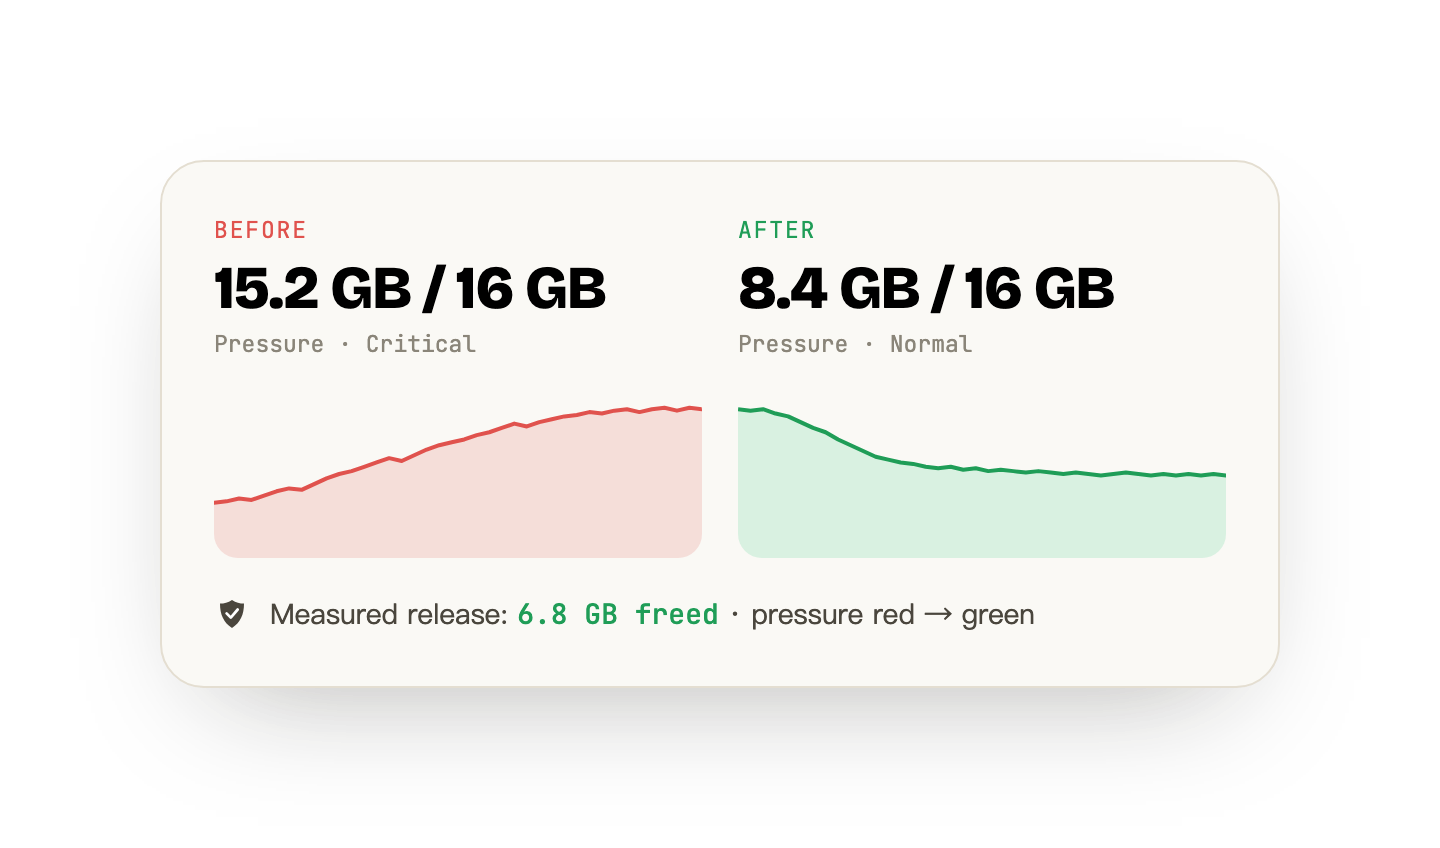
The numbers are macOS’s, not ours.
Every action records what the system reported before and after, and a gentle restart shows the memory it genuinely handed back. We never invent a "memory cleaned" figure - if an action did little, the log says so.
Solved step by step
From "something's wrong" to "fixed it" in three steps.
Memory-pressure check-up
A menu-bar readout of system pressure - green / yellow / red - plus swap and compressed-memory readings. Sandbox keeps it system-level only: an honest boundary, not a crippled build.
- Live pressure indicator
- Swap & compressed-memory readings
See what's eating your RAM
The non-sandboxed build attributes memory per app and per renderer, auto-flags the worst hogs, and shows current vs. peak - so you finally know what's causing it.
- Per-app & per-renderer attribution
- Auto hog detection
- Current vs. peak history
One-click control
Automatic threshold rules, Focus Mode for batching background apps, and gentle restarts - a restart is what actually hands the memory back, and it lets the app save first.
- Threshold automation rules
- Focus Mode (suspend / resume)
- Gentle restarts of top hogs
Guides
How macOS actually handles memory.
"Your system has run out of application memory"
What the macOS out-of-memory dialog actually means, why it fires on Macs with plenty of RAM, and how to find the process responsible instead of force-quitting at random.
Do Mac memory cleaners actually work?
What macOS already does with your RAM, what "free up memory" tools really change, and why 4% free RAM on a 64 GB Mac is a sign of health rather than trouble.
How to monitor RAM usage on a Mac
Activity Monitor, vm_stat and the menu bar — three ways to watch memory on macOS, and what every figure in the Memory tab means.
Stats vs iStat Menus vs Activity Monitor
Three ways to watch a Mac's memory and what each is actually for, including the honest answer about which to install first (the free one).
How to free up RAM on a Mac
What actually returns memory on macOS, what only appears to, and why the honest answer to this question is usually that you do not need to.
Is it a memory leak, or just a big app?
A leak has a signature you can measure: growth that survives idling and never comes back down. The test, a script that samples it, and what you can actually do when the leak is in someone else app.
Cached files in Mac memory
Several gigabytes, counted as used, and doing you a favour. What the figure contains, a measured reading, and why emptying it buys you disk reads rather than memory.
CleanMyMac alternatives, by what you actually used it for
CleanMyMac bundles five unrelated jobs. Replacing it starts with deciding which one you needed, because two of them macOS already does and one of them nothing can do.
What is wired memory on a Mac?
The one category in Activity Monitor with no owner and no process to quit. What it contains, why no app accounts for it, and the honest answer to whether you can reduce it.
How much RAM do I need on a Mac?
Three readings, taken over a week on the Mac you already have, answer this better than any recommendation can. The method, and where it points depending on what you find.
Is 8 GB of RAM enough on a Mac?
Both sides of that argument are describing their own workload. How to measure yours in a week, why an 8 GB Mac reports alarming numbers while working fine, and what to do if you already own one.
16 GB vs 24 GB MacBook Air: measure it, do not guess
You cannot add memory to an Apple silicon Mac later, so the decision deserves better than a spec sheet. Three readings you can take on the Mac you already have, and how to read them.
How much memory Mac apps actually use
A measured reading from one Mac with the method attached: what footprint, peak and RSS each say about the same app, why they disagree by more than you would expect, and the commands to take the same reading yourself.
How to uninstall CleanMyMac completely
Dragging it to the Trash leaves the background helper running. How to find every leftover on your own machine, so the method still works whatever version you have.
Anti-subscription
$19. Once. That's the whole deal.
No ads. No tracking. The app analyzes your memory entirely on your Mac and reports nothing back. A single purchase, yours to keep - backed by a 14-day, no-questions-asked refund.
- All Pro features, forever
- Free updates & support
- 14-day refund
Or start free - upgrade anytime